


By Pablo Bassil
Pablo is a senior software engineer with 15+ years of experience in full-stack development. He serves as tech lead at Red Ventures, building serverless architectures using React, Go, Node.js, and AWS. Pablo has also worked with Paychex on mobile and web applications.
Expertise



JavaScript memory leaks can be difficult to spot because applications often continue working normally while memory usage gradually increases. This guide explains the most common leak patterns, how to diagnose them in browsers and Node.js, and the practices that help prevent them.
Key Points
- A memory leak isn’t a bug the garbage collector missed. It’s a reference your application still holds to data it no longer needs: the collector only checks reachability, not intent.
- Most leaks in production trace back to one of seven recurring patterns: accidental globals, closures that share a scope, forgotten timers, lingering event listeners, retained promises and uncancelled async work, detached DOM nodes, and unbounded caches.
- Node.js services hide memory in places a heap snapshot doesn’t show, including Buffers, native bindings, and WebAssembly linear memory, so a clean heapUsed reading doesn’t mean a clean process.
- After it started running automated leak detection on a schedule instead of relying on manual code review, Meta’s engineering team reported cutting Facebook.com‘s out-of-memory crash rate by roughly half within two quarters.
JavaScript memory leaks rarely give themselves away. For a while, everything works. Tests pass. No errors show up in the log. Then, over the course of a user’s session or a server’s uptime, memory creeps upward until a browser tab turns sluggish or a container runs out of space and restarts. Here’s what engineering leaders need to know before that happens.
This creates two problems: a debugging problem, and an engineering leadership problem. Because the symptoms show up weeks after a commit, they survive a canary deployment and a twenty-minute load test, then resurface as a support ticket about performance: “the app is slowing down.”
JavaScript gives you automatic memory management. Garbage collection runs behind the scenes, finding objects your application can no longer access (they’re “unreachable”) and freeing them. That’s why most JavaScript developers never think about memory at all.
The catch sits in that word “reach.” The collector frees anything unreachable, but it can’t tell the difference between a reference you still need and one you forgot to remove. That distinction hasn’t changed even as the engines around it have been rewritten from the ground up.
How JavaScript Manages Memory, and Where the Model Breaks
Managing memory effectively starts with a working model of how the engine handles your objects. There are two things to track: where memory lives, and how the engine decides what to free.
A running function gets an execution frame, similar to a stack, holding its local information. When the function returns, the frame goes away. Anything that needs to survive the call gets stored on the heap, a large space holding your objects, arrays, functions, and strings. The engine is free to optimize or eliminate either representation, so treat this as a working model rather than a literal description of what runs.
Since the heap has no automatic termination point the way a returning function does, ordinary memory leaks become possible. Node buffers, WebAssembly linear memory, and native add-ons can also grow independently of the JavaScript heap, as later sections cover.
Early collectors used reference counting: track how many references point at an object, free it once that count hits zero. That approach couldn’t handle cycles: two dead objects pointing at each other kept each other’s counts above zero indefinitely. Modern engines use tracing instead.
Tracing starts from roots: the global object and whatever sits on the stack. V8 follows every reference from there, marks each reachable object as alive, then sweeps up everything still unmarked. This is mark-and-sweep, and V8’s implementation has had years of tuning under a project code-named Orinoco.
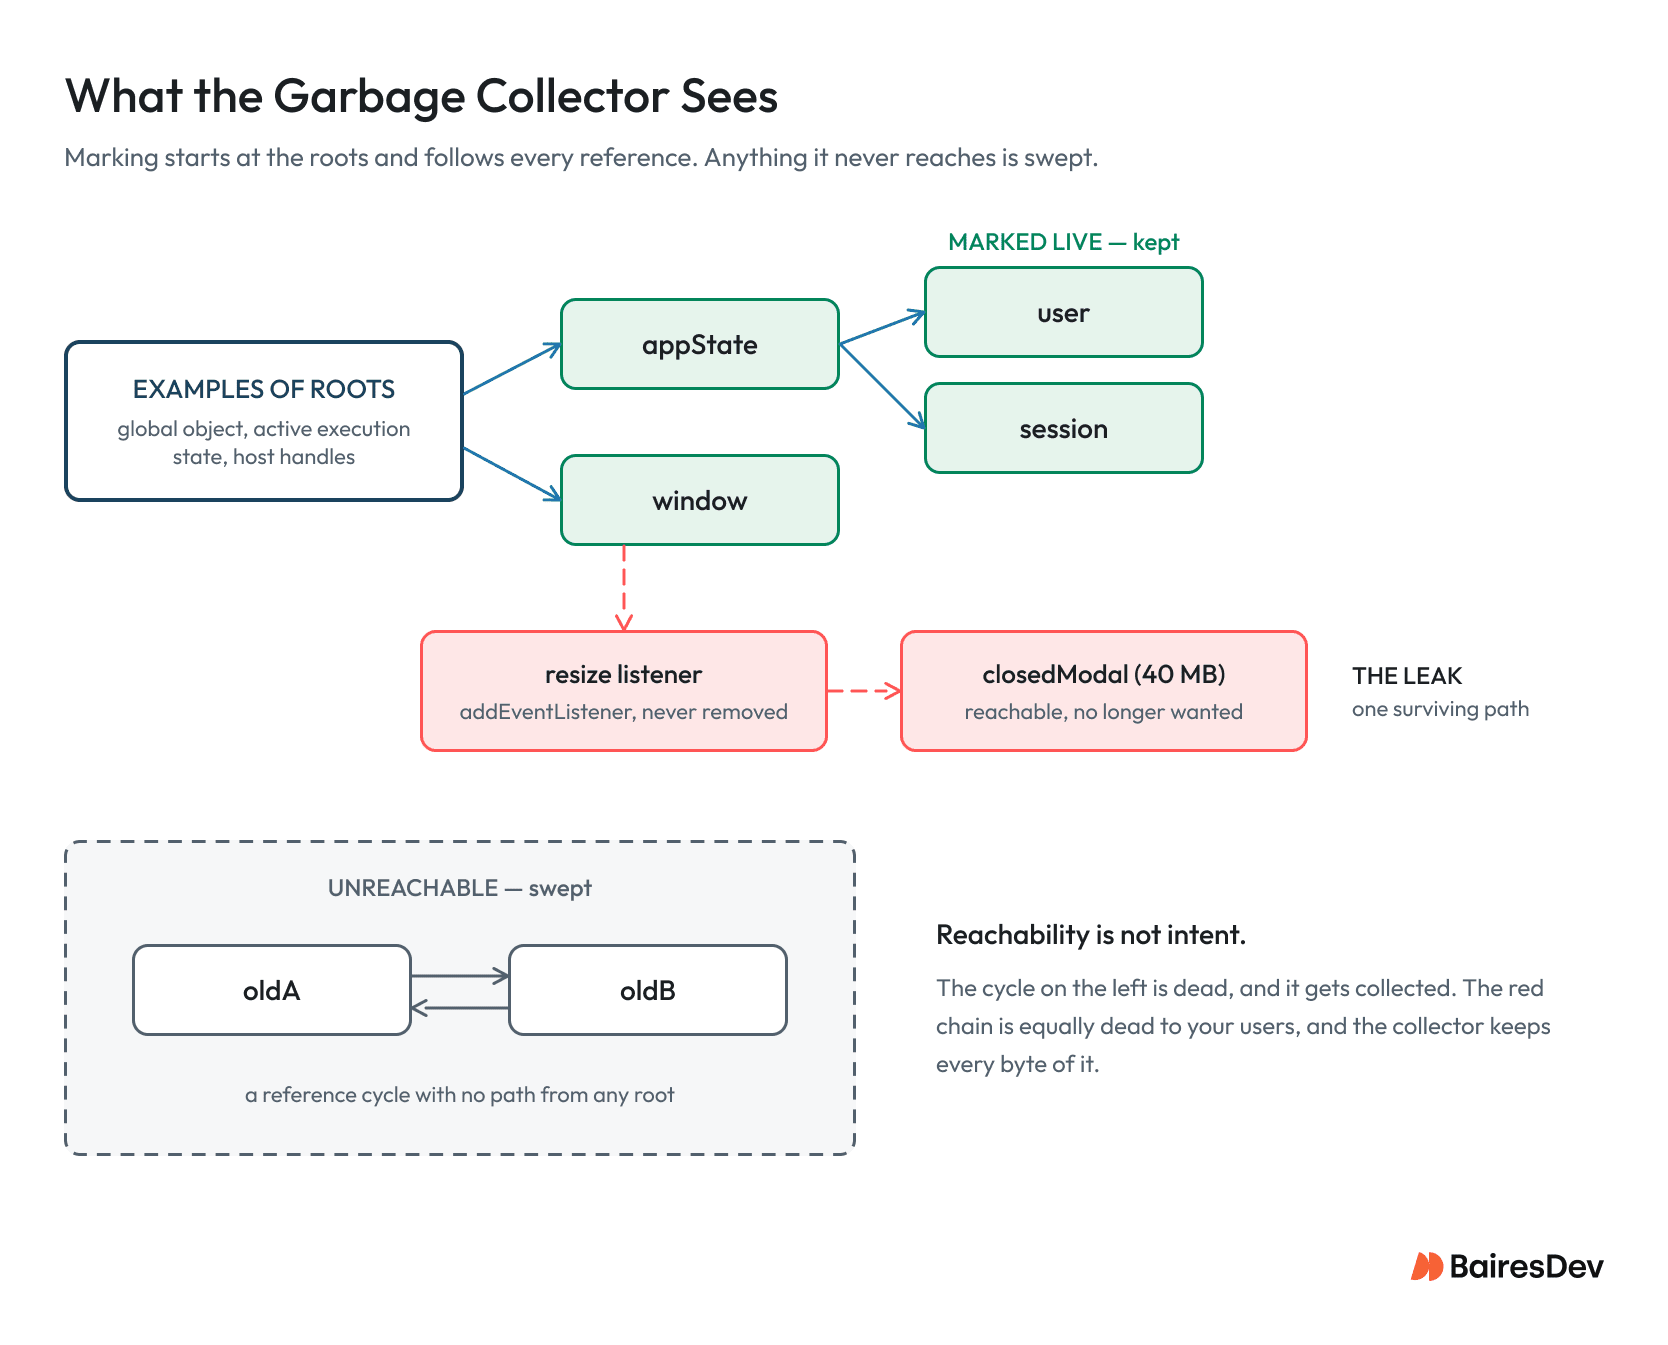
Mark-and-sweep reliably catches cycles. Dead objects pointing at each other are still disconnected from every root, so the mark phase never reaches them, and they get swept. That works because unreachable and unwanted usually mean the same thing. Usually. The collector can test whether it can still reach an object, but not whether you still want it. A leak is simply another name for a reference your application holds to data it no longer needs.
There’s one optimization that affects debugging directly. Because most objects die young, V8 divides the heap into generations: new allocations start in a nursery region, and objects that survive two collections get promoted to the older generation, where collection runs less often and takes longer. Leaked objects, by definition, survive, so older leaking objects tend to sit in the more expensive part of the heap.
That’s where Orinoco matters most. It moved marking and sweeping to background threads, freeing the main thread for your code. The published results are notable: the parallel Scavenger cut main-thread young-generation collection time by 20% to 50% depending on workload; concurrent marking and sweeping cut pause times in heavy WebGL games by up to 50%; idle-time collection reduced Gmail’s JS heap size by 45% while a tab sat idle. Every one of those gains applies to objects no longer reachable from a root. If your code keeps referencing an object, none of it helps.
Seven Common Leak Patterns in JavaScript
These patterns are ordered by when a leak is born: first, scope mistakes made at declaration time; then whatever a function captures at creation; then things scheduled or subscribed to while code runs, including async work still in flight; and finally, whatever outlives the component or process that created it.
Six of the seven show up in Node.js as well; detached DOM nodes are the browser-only exception. Most examples below use a browser component because a mount-and-unmount cycle is the easiest way to watch a lifetime start and end, but the mechanisms aren’t browser-specific.
Accidental Globals
1function cacheReport(rows) {
2// No let or const, so this becomes window.lastReport
3lastReport = rows;
4
5return lastReport;
6}
The cause is sloppy mode. Assign to a variable you never declared, and sloppy mode quietly creates a property on the global object instead of throwing a ReferenceError. Everything reachable from window stays reachable as long as window exists, so an accidental global sticks around until something deletes it, overwrites it, or the page’s realm goes away.
This is mostly a legacy problem now. Most application code ships as ES modules, which always run in strict mode, and strict mode turns an assignment to an undeclared name into a ReferenceError instead of a silent global.
If you’re still shipping classic scripts, add “use strict” to the top of each file and turn on ESLint‘s no-undef rule, which flags these mistakes before they reach the browser. Leave no-undef off in TypeScript files, as typescript-eslint recommends, since the compiler already checks undeclared names more accurately.
Browsers and Node both expose globalThis for accessing the global scope regardless of whether it’s called window or global, so code that needs to run in both environments should use it. Node has run ES modules in strict mode by default for years, so the same defense applies there.
What survives in modern codebases is usually intentional: a developer hangs state off window to poke at it in the console, then ships it that way. ESLint’s no-restricted-properties rule can flag known offenders, though it catches access to a restricted property, not just assignment to it. Anything beyond that is left to your team’s review process.
Closures That Capture a Shared Scope
A closure is an inner function that keeps access to its outer function’s variables even after that outer function returns. It’s one of JavaScript’s most useful features, and one of the easiest ways to hold far more memory than intended.
V8 promotes a captured variable to the heap only when at least one inner function references it, and it groups those promoted variables into a single context object. As Vyacheslav Egorov, a former V8 team member, explains in “Grokking V8 closures,” every closure created in a scope shares that one context. Once a variable enters the context, every sibling closure holds a reference to the entire context, not just the piece it uses. Other engines may build context objects differently, so treat this as V8-specific behavior.
1function createPanel() {
2   let rows = loadRows();           // 40 MB of report data
3   const panelId = nextId();
4
5   function render() {
6     draw(rows);                       // this closure needs rows
7   }
8
9   function onClose() {
10     console.log('closed', panelId);   // this one never touches rows
11   }
12
13   render();
14
15   // Both closures share one context, and rows is in it because render() uses it.
16   // So in V8, onClose retains that context, rows included.
17   return onClose;
18 }
Two separate things happen here. Returning onClose is what keeps that closure alive. Sharing the context is what makes onClose retain rows too. Pass the same closure to setInterval or an event listener and the result is identical, a pattern David Glasser documented at Meteor back in 2013, and one that still catches developers today.
The closure that leaks is rarely the one holding the data. It’s the small, innocent sibling you handed something long-lived.
Two fixes work. Move the heavy data out of the shared scope entirely, so no closure can capture it. Or reassign the variable to null once every closure that needs it is done, which is why the example above uses let instead of const for rows. Emptying the slot in the shared context leaves the context itself available for reuse. This is engine behavior, so it applies equally in Node.
Forgotten Timers and Intervals
Call setInterval and the runtime holds your callback in a timer queue so it can run again later. In a browser, that queue belongs to the tab; in Node, it belongs to the event loop. Either way, the callback still holds everything it closed over, so the queue transitively keeps that data alive.
1function startPolling(session) {
2   setInterval(() => refresh(session), 5000);
3   // No handle kept, so nothing can ever stop it
4 }
Because this function discards the interval ID that setInterval returns, there’s no way to cancel it later. The interval outlives the component, the route, and often the page itself.
1function startPolling(session) {
2   const id = setInterval(() => refresh(session), 5000);
3
4   return () => clearInterval(id);
5 }
Keep the handle and clear it: that’s the whole fix. In React, that returned function is exactly what useEffect expects back, and it runs on unmount:
1useEffect(() => {
2   const id = setInterval(() => refresh(session), 5000);
3
4   return () => clearInterval(id);
5 }, [session]);
The same discipline applies to setTimeout and any observer you register, and it applies unchanged in Node, with one added twist: an uncleared setInterval keeps the event loop running and prevents the process from exiting by default, unless you detach it with unref.
Lingering Event Listeners
Attach a handler to something long-lived, and that target now holds a reference to your handler function. Since the handler is a closure, it keeps alive every variable it captured from the surrounding scope.
1function mountChart(el, store) {
2   window.addEventListener('resize', () => redraw(el, store));
3 }
window lasts as long as the page is active. When the chart unmounts and the browser removes el from the DOM, window still holds the handler, and the handler still holds el and store, so neither can be collected. Mount that chart across twenty routes, each creating a fresh copy, and you’ve created twenty separate leaks.
The fix sounds obvious until a component subscribes to five different things and can be torn down five different ways: the user navigates away, an error boundary catches a throw, or the parent re-renders with different props. Rather than remove listeners one at a time, AbortController lets you produce a single signal to pass to every subscriber, then detach them all at once from whichever teardown path runs first.
1function mountChart(el, store) {
2   const controller = new AbortController();
3   const { signal } = controller;
4
5   window.addEventListener('resize', () => redraw(el, store), { signal });
6   store.addEventListener('change', () => redraw(el, store), { signal });
7
8   return () => controller.abort();   // removes both
9 }
For a handler that should fire only once, pass { once: true } as part of the options object; the browser removes the listener automatically after the first call.
1el.addEventListener('animationend', cleanupOverlay, { once: true });
2 // Combine both options when the component might be destroyed first:
3 el.addEventListener('animationend', cleanupOverlay, { once: true, signal });
once isn’t a substitute for lifecycle cleanup. If the event never fires before the component is destroyed, the listener stays attached to that long-lived target. Pass an AbortSignal too whenever the component can outlive the event. Node has its own version of this leak, listener accumulation on an EventEmitter, covered in the Node.js section below.
Retained Promises and Uncancelled Async Operations
Any async operation started during a component’s lifetime is a subscription like any other, and it can outlast the thing that started it. Neither browser tabs nor server request handlers are immune.
What’s worth ruling out first: a pending promise that nobody references isn’t, by itself, a leak. Unreferenced pending promises are normally collectible. The retention comes from one of two other causes.
First, a cache that keeps a pending promise’s resolve function, sometimes used to build deferred objects or an intermediary API layer, keeps the promise, and everything its continuation referenced, alive along with it. Second, an operation that simply never finishes: the socket stays open, its callbacks stay registered, its buffers stay allocated, whether or not anyone is still waiting on the result.
Put a timeout on any operation that isn’t guaranteed to finish, and cancel the underlying work, not just the promise. Racing a promise against a timeout only settles the outer promise: the losing request keeps holding everything it held before.
1async function loadReport(url) {
2   const controller = new AbortController();
3   const timeout = setTimeout(() => controller.abort(), 5000);
4
5   try {
6 const res = await fetch(url, { signal: controller.signal });
7
8 return await res.json();
9   } finally {
10     clearTimeout(timeout);   // runs whether it resolved, threw, or aborted
11   }
12 }
AbortController cancels this subscription too, and AbortSignal.timeout() wraps the typical timeout pattern in one call. Rejected promises are a separate concern: since Node 15, the default is –unhandled-rejections=throw, so an unhandled rejection becomes an uncaught exception and normally ends the process. Worth knowing before you upgrade an older service.
Detached DOM Nodes
A detached DOM node is an element removed from the document but still referenced from JavaScript. The browser can’t reclaim it while that reference survives, and because every DOM node points back to its parent and siblings, one retained element can pin an entire table in memory.
1const rendered = [];
2
3 function mountRow(data) {
4   const row = document.createElement('tr');
5
6   rendered.push(row);   // still held after the row leaves the page
7
8   return row;
9 }
Removing row from the document doesn’t help here, since rendered still points at it. Clearing the array, or scoping it to the component instead of the module, releases the whole tree.
Long lists make this worse, and the standard fix is virtualization, or windowing: render only what’s visible in the viewport and unmount everything else as the user scrolls. TanStack Virtual and react-window are common implementations. Without one, an infinite-scroll list keeps every row it’s ever rendered for the entire session.
Virtualization limits what’s mounted; it doesn’t limit what your own code retains. If you take a row a virtualized list returns and push it onto a module-scoped array or cache, the list still leaks: once the library drops its own reference, yours is the one still pinning the node.
Chrome adds a wrinkle: once you pass an object to console.log, Chrome keeps a reference to it so you can inspect the expanded view later. Meta documented this behavior while building its own tooling, and it explains a fair number of confusing debugging sessions.
Unbounded Caches
Caching trades memory for speed on purpose. It becomes a leak once nobody decides how much memory to trade. A Map holds both its keys and values with strong references, so an entry stays alive until you delete it.
1const priceCache = new Map();
2
3 function quote(instrument, price) {
4   priceCache.set(instrument, price);   // strong key, no bound, no expiry
5 }
Every instrument object ever passed to quote stays reachable through that Map for as long as the tab or process runs. Two fixes apply, depending on what the keys represent. If the keys are objects whose lifecycle something else controls, use WeakMap: its keys are held weakly, so an entry becomes collectible once nothing else references that key. Timing of the actual collection is undefined.
1const priceCache = new WeakMap();
2
3 function quote(instrument, price) {
4   priceCache.set(instrument, price);
5 }
6
7 function lastQuote(instrument) {
8   return priceCache.get(instrument);
9 }
The call sites don’t change. The difference shows up once an instrument object is no longer used anywhere else: at that point, both the key and its cached price become eligible for collection, with no eviction code required.
If the keys are strings, or you want a fixed ceiling, use an LRU cache: it evicts whatever’s gone untouched the longest once it hits the limit you set. The lru-cache module’s own history is instructive: maxAge was deprecated in favor of ttl in version 7, and version 11 requires at least one of max, maxSize, or ttl to avoid unsafe unlimited storage. TTL alone doesn’t cap memory: stale entries stay available until someone asks for them again, so a stale entry nobody touches after it expires can sit there indefinitely. ttlAutopurge sets up a timer that drops entries as soon as they expire.
1import { LRUCache } from 'lru-cache';
2
3 const compiled = new LRUCache({ max: 500, ttl: 1000 * 60 * 5 });
Meta found the same shape at scale: unbounded caches and infinite-scroll lists without virtualization were, by its own account, the top two causes of excessive memory growth across its web applications. Node behaves identically here, and it matters more, since a server process runs for weeks rather than a single browsing session. Server rendering sharpens the problem further: architectures that compile templates into render functions, or execute generated code via new Function(), typically cache the compilation results, and V8 keeps every one of them in memory for as long as it stays reachable. Give any such cache a maximum bound; skipping one costs process uptime.
The Causes-to-Fixes Matrix
All seven patterns run on the same mechanism and show up differently. Use this matrix as a review checklist.
| Leak Source | How It Happens | How to Fix and Prevent It |
| Accidental globals | Sloppy-mode assignment to an undeclared variable creates a property on the global object, which is a root. | Use ES modules or “use strict,” enable ESLint’s no-undef rule, and null any intentional globals when done. |
| Closures sharing a scope | One closure pulls a large variable into the shared context, so a retained sibling closure keeps that context alive. | Move heavy data out of the shared scope, or null the variable once its work is finished. |
| Forgotten timers | The timer queue holds the callback, and the callback holds everything it captured. | Store the handle and call clearInterval, returning it from useEffect in React. |
| Lingering listeners | A long-lived target retains a handler that belongs to a short-lived component. | Call removeEventListener or wire an AbortSignal through the subscriptions; add { once: true } when a listener should also remove itself after firing. |
| Retained promises and uncancelled async work | Something holds the promise, its resolver, or its continuation, or the underlying operation never cancels and keeps its sockets, callbacks, and buffers. | Add a timeout and cancel the underlying work with AbortController, since racing a timeout settles only the outer promise. |
| Detached DOM nodes | JavaScript keeps pointing at elements removed from the document tree. | Clear the arrays and fields holding them, and avoid caching element collections in module scope. |
| Unbounded caches | Map and plain objects hold keys strongly and grow without a ceiling. | Use WeakMap for object keys, or an LRU cache with a hard max and a ttl. |
Can a Linter Catch These?
Some of them, if you’re using React or Angular and have the right plugins installed.
For React
react-hooks/exhaustive-deps checks dependency arrays, not cleanup, so a useEffect that adds an event listener and returns nothing passes the rule without complaint.
The ESLint React project’s react-web-api rule set fills that gap: because these rules understand components and hooks, they can tell whether a cleanup function came back from each one. They don’t analyze non-component scripts or class-based widgets.
| Rule | What It Checks |
| no-leaked-event-listener | Every addEventListener has a matching lifecycle cleanup (removeEventListener or AbortSignal). |
| no-leaked-interval | Every setInterval has a matching clearInterval . |
| no-leaked-timeout | Every setTimeout has a matching clearTimeout . |
| no-leaked-fetch | Every fetch request was cancelled via an AbortController (the project calls this an experimental check that may still produce false positives or negatives). |
| no-leaked-resize-observer | Every ResizeObserver instance was disconnected. |
| no-leaked-intersection-observer | Every IntersectionObserver instance was disconnected. |
For Angular and Beyond
Angular‘s equivalent targets the failure mode that dominates there: an RxJS subscription that outlives its component. The prefer-takeuntil rule flags any subscribe call inside a component that isn’t paired with takeUntil, and the same plugin adds prefer-composition and prefer-async-pipe.
For ESLint 9 and flat configuration, the maintained fork is eslint-plugin-rxjs-angular-x; it can detect Angular 16’s takeUntilDestroyed, but only if you list it in the rule’s alias property, which is empty by default.
For Vue, Svelte, and framework-neutral JavaScript, there’s no maintained rule suite comparable to React’s or Angular’s. A Vue watcher whose stop handle never gets called, or a vanilla widget that never removes its listeners, will usually pass linting without complaint. Knowing that up front matters before you assume your pipeline has this covered.
Even at its best, coverage stays incomplete. ESLint’s core catches accidental undeclared globals; the React rules cover timer, listener, observer, and fetch cleanup inside effects; the Angular rules enforce certain RxJS subscription patterns.
Static analysis still can’t tell whether a cache is bounded, how long a closure outlives its data, or whether a detached DOM node is being held on purpose. No general rule can decide whether a given Map should have been a WeakMap: a linter would need to know whether a long-lived cache was intentional or accidental, and either one looks like new Map() to it. The same limit applies to closure capture and detached nodes: a linter can see the code, but not the lifetimes.
Preventing Leaks by Design
Linting helps because it moves some of the problem outside human memory, but a rule can only check for a cleanup call it already knows to look for. A stronger guarantee comes from building cleanup into the language itself, so the runtime handles it instead of a reviewer verifying it by hand. JavaScript and TypeScript have both recently added exactly that.
Deterministic Cleanup With using and Symbol.dispose
Explicit Resource Management ties an object’s cleanup to the block where it was defined. The mechanism is a new using declaration: when the enclosing block exits, whether it runs to completion, returns early, or throws, the engine calls that object’s [Symbol.dispose]() method. There’s no method literally named dispose(); the symbol-keyed one is the contract. The proposal reached Stage 4 at TC39, with a targeted ECMAScript 2027 publication.
1class ChartPanel {
2   #controller = new AbortController();
3
4   constructor(el, store) {
5     this.el = el;
6     this.store = store;
7     window.addEventListener('resize', () => this.draw(), {
8       signal: this.#controller.signal
9 });
10   }
11
12   draw() {
13     redraw(this.el, this.store);
14   }
15
16   // Symbol.dispose is the well-known symbol that `using` looks for.
17   // Use Symbol.asyncDispose with `await using` for async teardown.
18   [Symbol.dispose]() {
19     this.#controller.abort();
20   }
21 }
22
23 function renderReport(el, store) {
24   using panel = new ChartPanel(el, store);
25   panel.draw();
26 }   // dispose runs here, even if draw() throws
using provides deterministic teardown for resources you explicitly manage: listeners, timers, connections, file handles. It doesn’t help you collect heap objects, so it won’t save you from an unbounded cache.
The full proposal is bigger than the using keyword alone: Symbol.dispose and Symbol.asyncDispose are the well-known symbols using calls; DisposableStack and AsyncDisposableStack let you register multiple resources in one container and dispose them all, in reverse order, at once; and SuppressedError is an error type that carries both the cleanup error and the original error it would otherwise mask.
Node.js 24 supports the whole proposal today: it shipped in May 2025 with V8 13.6 and entered long-term support in October 2025. Browser support is more mixed: Chrome 134 and Firefox 141 have the complete feature, while Safari 26 ships the disposal symbols, SuppressedError, and synchronous DisposableStack, but not the using declaration or AsyncDisposableStack. That’s why MDN still marks using “limited availability” rather than “baseline.” Browser code that has to run on Safari needs the syntax transpiled, or should use DisposableStack directly where it’s supported.
Two neighboring APIs look like they solve the same problem, and they don’t. A WeakRef points at an object without preventing its collection, letting you check later whether it’s been collected.
A FinalizationRegistry goes further: you supply an object and a callback to run once it’s collected, which looks like a natural cleanup hook. It isn’t one: TC39’s proposal states plainly that a finalizer can run long after its object was collected, in whatever order the engine chooses, or never at all. An engine that exits, or never finishes a full collection cycle, owes you nothing. MDN goes further still, saying proper use of WeakRef needs serious consideration and should generally be avoided.
The practical rule: use WeakMap when you want entries to become collectible along with their keys, and using when you want cleanup at a moment you control. Never put anything you truly need, closing a connection, releasing a lock, inside a finalizer callback.
What TypeScript Does and Doesn’t Catch
None of this shows up in a TypeScript compiler check. Types get erased at compile time, so strict: true doesn’t help with lifetimes: an uncleared timer is still perfectly typed, and a Map that grows without bound looks more disciplined than a plain object while behaving exactly the same way.
TypeScript does give you one way to enforce the cleanup contract at build time. Version 5.2, shipped in August 2023, added using and await using ahead of every runtime, along with the global types Disposable and AsyncDisposable. A class that implements Disposable won’t compile unless it defines [Symbol.dispose()].
1class ChartPanel implements Disposable {
2   readonly #controller = new AbortController();
3
4   constructor(private readonly el: HTMLElement) {
5     window.addEventListener('resize', () => this.draw(), {
6       signal: this.#controller.signal,
7 });
8   }
9
10   draw(): void {
11 // Render the panel.
12   }
13
14   [Symbol.dispose](): void {
15     this.#controller.abort();
16   }
17 }
One configuration detail trips people up: these types live behind the esnext.disposable library, so compilerOptions.lib needs to include esnext or esnext.disposable for Disposable to resolve.
The same pattern works without classes. When you set something up that needs teardown later, return the teardown function and describe that in the type.
1type Teardown = () => void;
2
3 function watchResize(el: HTMLElement): Teardown {
4   const controller = new AbortController();
5
6   window.addEventListener('resize', () => reflow(el), {
7     signal: controller.signal,
8   });
9
10   return () => controller.abort();
11 }
The return type is the contract. Anyone reading the signature knows watchResize hands back a function they’re supposed to call later. Discard that value, and it’s a visible decision at the call site, rather than an oversight that goes unnoticed, the same shape React chose for useEffect, applied to your own code.
How Do You Detect a Memory Leak in the Browser?
Try it as you read. The interactive Leak Lab, available in the archive, produces increasing allocation floors, detached DOM nodes, persistent listeners, and retained closure contexts on demand, so you can practice each of the following steps against a controlled leak.
Suspicion is cheap and evidence isn’t, so the workflow below starts by confirming a leak exists before you spend time hunting it. Every step below uses Chrome DevTools. Some leaks don’t show up in short runs: they need a long scenario, or real production traffic, before they surface. Don’t treat a clean short test as an all-clear; treat it as inconclusive.
1. Confirm the increase
Open Chrome’s Task Manager (Shift + Esc on Windows and Linux; the Window menu on macOS, with no default shortcut). Right-click the header and add the JavaScript Memory column. The figure in parentheses is live heap memory. If repeated activity pushes allocations up and they never fall back to their starting level, you may have a problem worth chasing.
2. Read the trend line
In the Performance panel, check the Memory box and record one minute of the suspected flow. A healthy pattern looks like a sawtooth: allocations rise as items get added, then the collector runs and memory drops back near its previous level. A leak tilts that floor upward over time.
3. Compare heap snapshots
In the Memory tab, capture a baseline snapshot in a known-good state, perform the suspect flow, undo it, force garbage collection with the trash-can icon, then capture a second snapshot. Switch from Summary to Comparison view. Anything allocated during the flow that survives the subsequent collection is a candidate.
4. Profile detached elements
Chrome offers two ways to find them: filter for “Detached” in a snapshot’s Summary view, or record a detached-element profile, which shows how many detached nodes are referenced from JavaScript and where.
5. Follow the retainers
Select a surviving object and open its Retainers pane. The retainer chain shows the path of references from a GC root to that object, typically the array that owns the item, the handler listening for it, the closure that references it implicitly, or the property that points at it. That narrows the search considerably, though tracing it back to the responsible code, and the right fix, is still work.
6. Read the right-hand columns
Each snapshot reports three metrics, and knowing which to sort by saves review time.
| Metric | What It Means | How to Apply It |
| Distance | The number of property references on the shortest path from a root to this object. | An anomaly against otherwise-identical peers points to an unexpected retention path. |
| Shallow Size | The memory used solely by this object. | Usually small; mainly arrays and strings consume significant amounts on their own. |
| Retained Size | The memory that would be reclaimed if this object, and anything reachable only through it, were removed. | The one to sort by, since a tiny object can gate access to a huge graph. |
All six steps assume a browser tab you can point DevTools at. Server-side code is a different story, with a different set of patterns to look for.
Memory Leaks in Node.js
A browser leak costs one user a slow tab. The same bug in a Node service costs every request on that instance.
Listener Accumulation on EventEmitters
Node’s event-driven APIs use EventEmitter, an object that lets you attach handlers. Attach one inside a request handler, and every request creates a new listener, each with access to everything the function closed over.
1const bus = new EventEmitter();
2
3 app.get('/report', (req, res) => {
4   bus.on('ready', (db) => res.end(db.get()));   // one listener per request
5 });
Node gives you some notice: once more than ten listeners attach to the same event, it emits a MaxListenersExceededWarning, a warning rather than a limit, since Node keeps accepting listeners regardless. Many teams find that notice noisy and suppress it with setMaxListeners(0), losing their one early signal in the process. The fix is straightforward: use once for handlers that should fire a single time, so Node removes them automatically, and otherwise remove the listener explicitly when the connection closes.
How Much Does This Actually Cost? A Benchmark
We ran two original tests for this article to answer a narrow question: for a given amount of traffic, how many bytes does this retention pattern hold onto, and does a heap snapshot reveal it? The numbers came from testing Node 22 and V8 12.4.
To get the answer instead of estimating it, we ran a benchmark ourselves, [available in the archive]. We tested 10,000 sequential requests over loopback against the same listener-accumulation pattern, using Node’s built-in http module rather than a web framework. Each request allocated a 4 KB Buffer. Between runs, we forced garbage collection and captured the difference in process.memoryUsage, discarded two warm-up runs, and collected five samples per configuration on two machines running different V8 builds.
Leaky version: about 39.1 MB of buffer backing store per 10,000 requests, all under arrayBuffers, plus a median 3.5 MB of total V8 heap growth across the five runs. Every listener stayed attached, and the buffer count matched the prediction exactly: 10,000 allocations of 4 KB each. Fixed version: no listeners remained at the end of any run, and arrayBuffers showed no measurable growth. The arrayBuffers figure was identical on both machines, which tracks, since it depends on request count rather than hardware.
arrayBuffers represents a category of backing stores outside the V8 heap; heapUsed measures the V8 heap itself. Combined, measured growth came to about 42.6 MB, with the JavaScript heap accounting for roughly 8% of that.
The second experiment produced the more useful result. We expected a heap snapshot to miss the buffers entirely, since they live outside the V8 heap, so we captured a real snapshot before and after the same workload and summed self_size across every node. The snapshot’s totals accounted for almost all the measured growth, 43.2 MB against 43.2 MB, and node count roughly doubled, from about 64,300 to about 136,200.
The breakdown explains why. In this Node 22 / V8 12.4 run, each retained backing store showed up as a native system / JSArrayBufferData node.
| Node Type / Name | Growth | Nodes Added |
| native / system / JSArrayBufferData | 39.1 MB | 10,000 |
| object / Buffer | 0.9 MB | 10,000 |
| object / ArrayBuffer | 0.8 MB | 10,000 |
| closure | 0.5 MB | 10,000 |
| object / system / Context | 0.4 MB | 10,000 |
The tool to trust less here is heapUsed, not the snapshot. Monitoring heapUsed alone would show only about 4.1 MB of growth, making the service look healthy while it held onto roughly forty.
Three caveats apply before drawing broader conclusions. This snapshot comparison is a single run, not a repeated benchmark. How snapshots represent backing stores depends on the specific V8 build, and DevTools’ view of them has changed over time. Resident set size fluctuated too much across repetitions to report a meaningful variance, since it also captures native code and allocator behavior. Compare the full picture against your own runtime; monitor arrayBuffers for this leak pattern specifically, and inspect the native nodes in a snapshot rather than searching only for your own class names.
How to Profile a Node.js Process
Without a browser tab to inspect, attach the inspector instead: run the process with –inspect, then connect Chrome DevTools for the same Memory panel and snapshot-comparison flow described above. You can also capture snapshots programmatically with v8.writeHeapSnapshot, triggered on a signal so you can pull one manually without redeploying.
Use caution on a live instance. Node’s own documentation warns that the operation runs synchronously, blocks the event loop for a period proportional to heap size, needs roughly double the current heap space just for the diagnostic, and can trigger the out-of-memory kill you’re trying to investigate. A drained instance, a canary, or a replica is a much safer target.
For steady monitoring, sample process.memoryUsage periodically and send four fields to your APM platform: heapUsed (the V8 heap), arrayBuffers (Node Buffer and JavaScript array buffer allocation), external (memory tied to C++ object bindings), and rss (total resident process memory). Because arrayBuffers sits inside external, the difference between the two matters when you’re reading trends.
Watch shape and level together. A slope alert catches a leak while you still have options; a headroom alert, comparing usage against the container limit, catches the case where a steady process approaches its ceiling, whether from a traffic spike, a snapshot capture, or something else, and gets killed for it. Put restart counts and OOM kills on the same dashboard.
WebAssembly: Who Frees the Memory?
WebAssembly lets code written in C, C++, or Rust run in the browser and in Node at close to native speed. Teams reach for it when JavaScript is the bottleneck: image and video processing, PDF rendering, CAD, cryptography, in-browser machine learning. It also brings a different memory model, and that’s where its leaks come from.
Linear Memory and Detached Views
Modules using standard linear memory work off a single contiguous byte block, exposed to JavaScript through a WebAssembly.Memory instance. That memory may be created in JavaScript, exported from the module, or shared across multiple instances. It is not the JavaScript heap: it behaves like the output of malloc in a C program, and the module’s own memory manager decides where each allocation lives inside it.
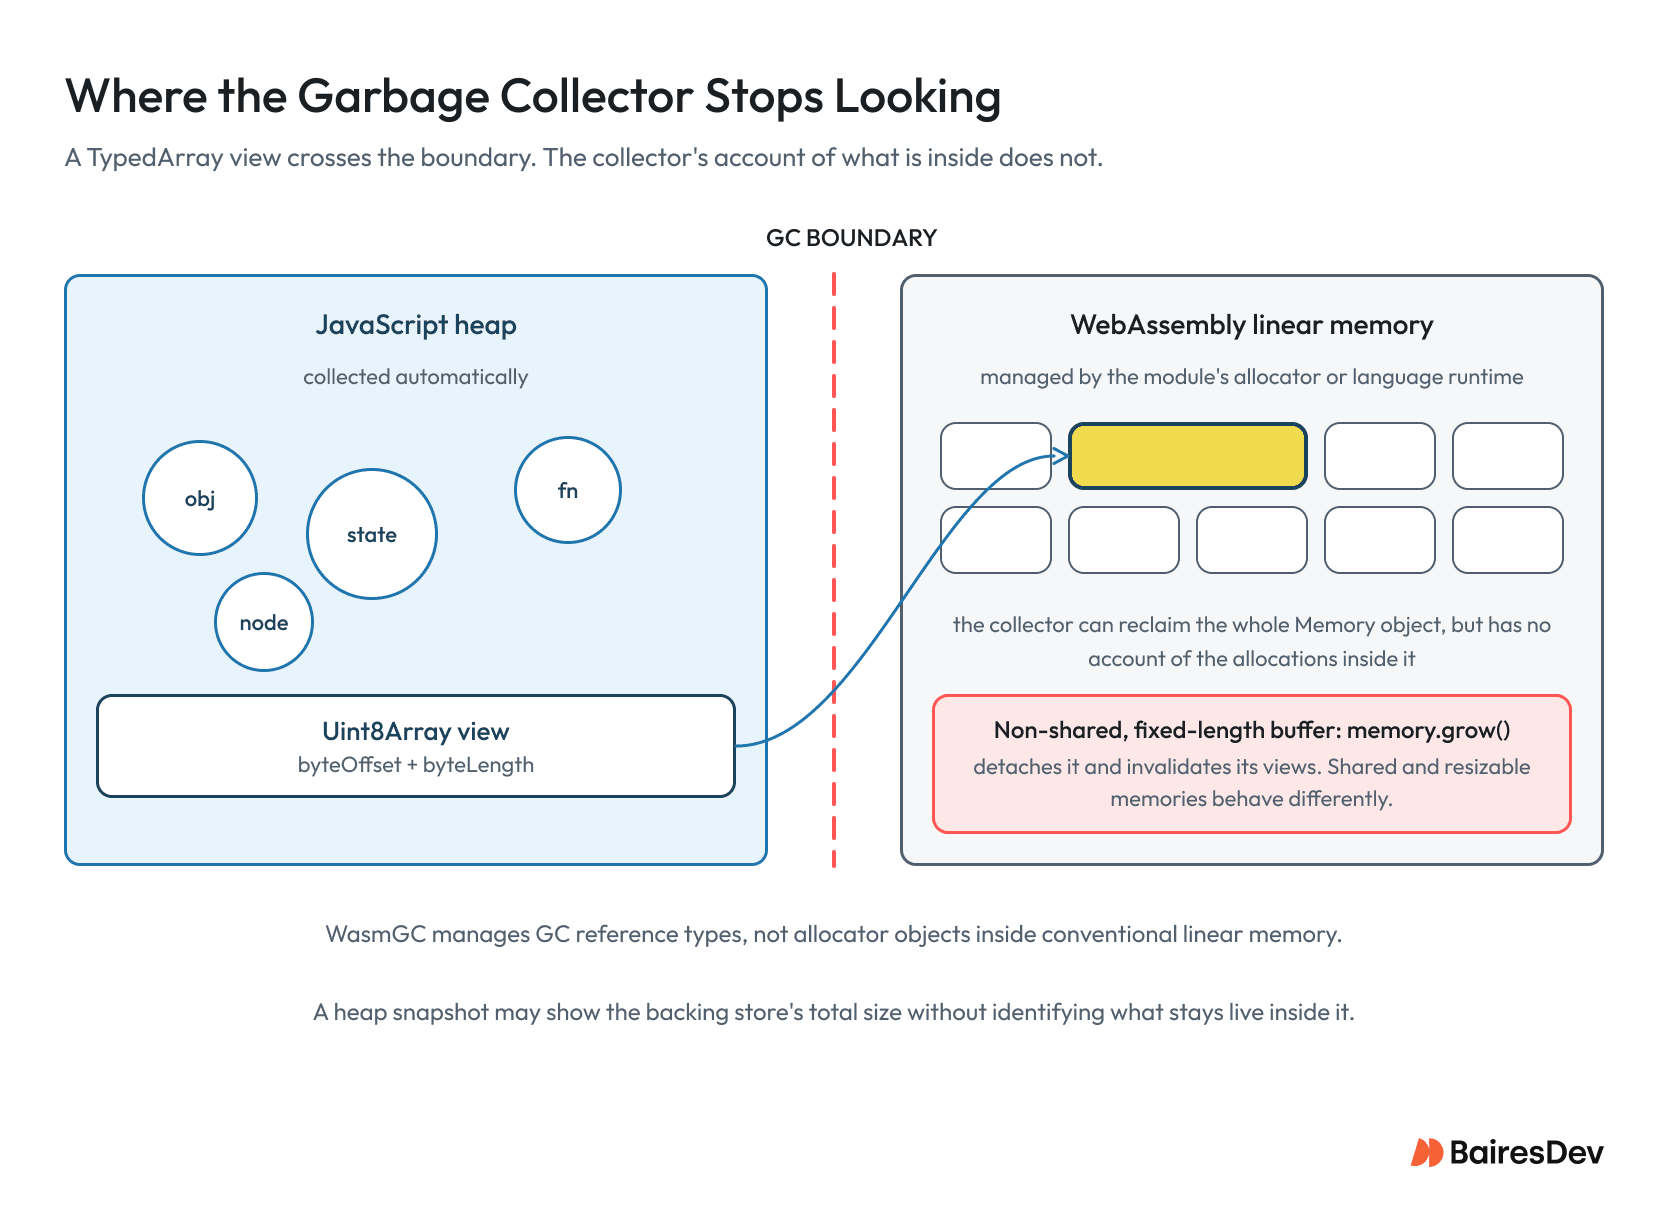
Once the last reference to the memory object goes away, the collector can drop the whole WebAssembly.Memory object, but it can’t look inside it. If a C++ module allocates a structure there and never frees it, the collector never finds out, and couldn’t act on it if it did.
WasmGC answers a narrower question than its name suggests. It shipped in Chrome 119 in October 2023, then Firefox 120, and Safari 18.2. It adds a separate, garbage-collectible storage system for struct and array types, the target languages like Kotlin and Dart compile to when targeting Wasm. It does nothing for memory allocated inside linear memory, so a C++ or Rust module remains just as responsible for managing its own memory as before.
JavaScript accesses linear memory through a TypedArray, a view mapping raw bytes onto something indexable, like a Uint8Array. That mapping doesn’t copy data, which makes it efficient and fragile at the same time. The fragility shows up when linear memory needs to grow. Read it through a non-shared, fixed-length memory.buffer, then call memory.grow(), and that buffer detaches: you get a new buffer back, while every view over the old one silently becomes a zero-length array.
Shared memories behave differently: growing a shared memory doesn’t detach an existing SharedArrayBuffer, but its length doesn’t increase either, so views over it keep working while silently missing the newly added regions. Resizable buffers, created with toResizableBuffer(), grow in place, so length-tracking views stay valid, but they’re still relatively new, so feature-detect the API rather than assume it’s available, and confirm which buffer form your bindings use before debugging.
Embind Object Handles
Raw byte views are one way to cross the boundary. Handing whole C++ objects to JavaScript is the other, and it’s the leak you’re more likely to actually hit. Embind, Emscripten’s bridge for this, gives JavaScript a handle, a lightweight wrapper pointing to an object that still lives in linear memory. Collecting the wrapper does not release the underlying C++ object, so every handle needs an explicit delete, or the Emscripten heap grows without bound.
Embind now integrates with using declarations, which makes forgetting a delete much less likely:
1function processImage(bytes) {
2   using img = new Module.RawImage(bytes);
3
4   return img.analyze();
5 }   // img.delete() runs at scope exit
Embind also supports finalizers, but Emscripten’s own documentation advises against relying on them, citing the same lack of determinism in timing and execution order that led TC39 to the same conclusion about JavaScript finalizers.
Debugging across this boundary needs different tools entirely. Compiling with -fsanitize=address enables AddressSanitizer and LeakSanitizer, which trap allocation events on the C++ side and produce a backtrace for memory that’s never released. Leak reporting happens at program exit, so Emscripten’s docs pair -fsanitize=address with -sEXIT_RUNTIME. Leave that off, and a library-style build never reaches the reporting phase.
A heap snapshot handles this worse than it handles Node buffers. Linear memory shows up as one large buffer, so you can watch it grow without learning which allocation inside it is responsible. Memory a native add-on allocates outside V8 may not appear in the snapshot at all.
Foreign Function Interfaces: Who Owns the Lifetime?
A foreign function interface (FFI) lets JavaScript call into an existing compiled library directly, describing that library’s function signatures instead of compiling a custom binding to match a runtime’s internal API. That raises a question the language itself usually answers: when two runtimes share an object, which one owns the responsibility for releasing it?
| I once segfaulted a Node process from a C extension on purpose, to see what it would look like from the JavaScript side. And I can tell you, it looked like nothing. The process was gone. As soon as you cross an FFI boundary, all the guarantees your runtime gives you stop at that border. |
That failure mode is documented, not exotic. A segmentation fault is an operating-system signal, so it never reaches JavaScript, and process.on(‘uncaughtException’) never sees it. The node-ffi README warns outright that you can easily segfault the interpreter, and that without C debugger skills you won’t know why.
The node-ffi Trade-Off
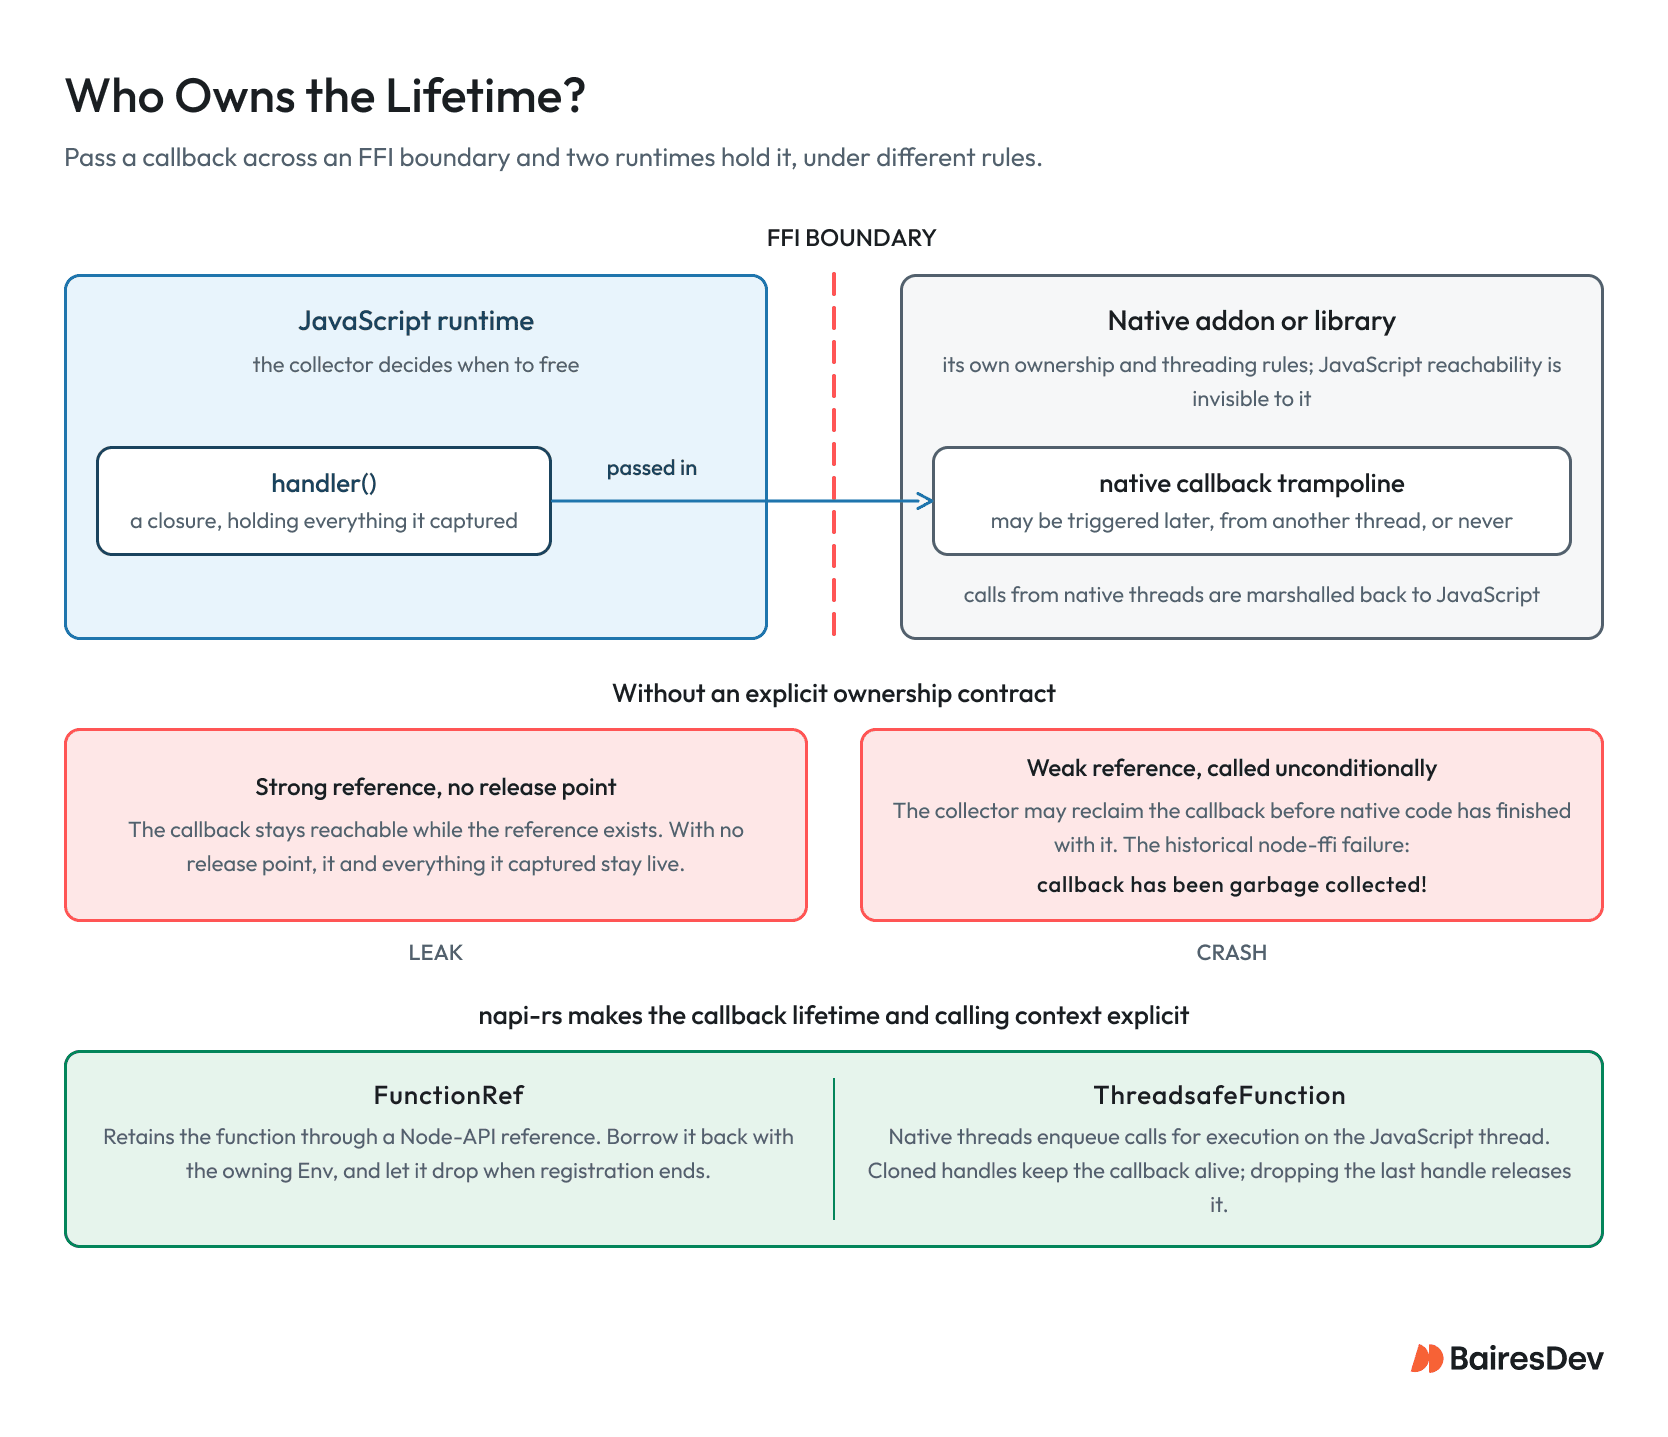
Memory management across this interface used to fail more subtly. Users of node-ffi hit a runtime error for years, ffi fatal: callback has been garbage collected!, documented across issues filed between 2012 and 2018. One Electron app for macOS saw roughly 2% of users fail to log in sporadically because of it.
A maintainer explained the reasoning in a GitHub thread: the callback reference has to be weak because FFI can’t know how long native code will need it, and it can’t hold the callback forever without leaking memory. That’s the ownership problem in plain terms: hold a callback indefinitely and you leak memory; release it before native code finishes and you crash. Neither runtime knows which case applies.
node-ffi-napi later forked the project onto Node-API so it would survive future V8 updates, but neither project has shipped a new release recently, and the fork’s own README still describes the inherited API as having poorly defined garbage-collection and threading behavior. Teams building native bindings today typically reach for napi-rs, Koffi, or ffi-rs instead.
How napi-rs Answers It
napi-rs resolves the ownership question by refusing to pick a default: it asks developers to specify, in the type itself, exactly what they need, for both callbacks and data.
For callbacks, it offers two options. FunctionRef holds a JavaScript function using a Node-API reference, borrowed back through the owning Env and released once the wrapper goes out of scope at the end of registration. That’s protection against garbage collection, but not the ability to call the function from an arbitrary native thread. ThreadsafeFunction is for calls from a background thread: it queues those calls to run on the JavaScript thread, stays alive as long as any cloned handle exists, and drops its reference once the last handle does.
Data follows a similar split. Owned values like Buffer get a tracked reference that’s released when the Rust wrapper drops, though that doesn’t necessarily destroy the value itself, since other code may still hold it. Borrowed values like BufferSlice<‘env> are zero-copy and bound to the function scope; the compiler rejects any attempt to carry them across an await or out of the call.
This mirrors using in JavaScript and Disposable in TypeScript, one level further down. All three enforce ownership at different times: using, Symbol.dispose, and DisposableStack run at runtime, so the engine disposes of them; Disposable is a TypeScript type with no runtime presence, checked entirely at compile time and free at runtime; and napi-rs relies on the Rust compiler to verify borrowed lifetimes before any code runs. In every case, ownership stops being a convention a reviewer has to remember and becomes something a machine enforces.
What Leaks Cost, and How Teams Prevent Them
Memory leaks generate two kinds of cost. One is obvious. The other rarely shows up on a technical-debt slide.
Reliability cost is the obvious one. Kubernetes enforces memory limits reactively: under memory pressure, the kernel’s OOM-killer terminates one of a container’s running processes. If that process is the service itself, every active request on that instance drops, and whether the container comes back depends on its restart configuration. In the browser, high memory consumption means the old generation gets collected more often, and even though marking runs concurrently, finalization and compaction still pause the main thread and cause visible stutter.
The cost that compounds is provisioning. Every Kubernetes container declares a memory request, what the scheduler should reserve, alongside a memory limit, the ceiling enforced reactively when memory pressure hits. Teams that have been paged at 3 a.m. tend to set those requests high, and the scheduler reserves that capacity on the node whether it’s used or not, which then counts against whatever else could have been placed there.
Industry research backs this up. CAST AI’s Kubernetes Optimization Report, based on tens of thousands of production clusters across AWS, Azure, and Google Cloud, found average memory utilization of 20% and memory overprovisioning of 79%.
A separate, earlier CAST AI analysis of more than 4,000 clusters, reported by The Register in 2024, found much the same shape: clusters with 50 or more CPUs typically used only 13% of provisioned CPU and 20% of provisioned memory.
Datadog’s 2023 analysis of more than 2.4 billion containers reached a similar conclusion: more than 65% of Kubernetes workloads used less than half their requested CPU and memory.
All three studies point to several reasons for the excess headroom: traffic variability, start-up spikes, native memory allocation, overly conservative defaults, and limited visibility into resource consumption. Leaks make that list. They don’t top it, and they don’t cause it. What they add is narrower but real: once memory has climbed for weeks with nobody able to say why, teams stop trusting a tight limit.
Case Study: How Meta Reduced Out-of-Memory Crashes
After rebuilding Facebook.com as a single-page application, Meta saw both memory usage and client-side out-of-memory crashes climb, and manual DevTools investigation couldn’t keep pace with daily shipping volume.
Its engineering team built MemLab, a framework that drives a headless browser through a scripted sequence with Puppeteer and diffs heap snapshots taken before and after, to surface objects that should have already been released. Running it on a schedule against internal dashboards, rather than relying on manual review, is credited with cutting Facebook.com‘s out-of-memory crash rate by roughly half in the first half of 2021.
Two individual changes illustrate how much a single fix can move the number. Aggressive cleanup of unmounted component trees, later shipped upstream in React 18, cut average memory usage on Facebook by nearly 25%. Deduplicating repeated cache-key strings in the data layer cut memory p99 and out-of-memory crashes by a further 20%.
Meta’s own rationale for automating this applies to any team: leaks seldom get caught in code review, are hard to spot during development, and are harder still to isolate in production, which makes them poor candidates for manual review.
The Practices That Prevent Leaks
Linting is the cheapest place to start, and once configured it runs on its own. Enable no-undef in every JavaScript codebase, the ESLint React react-web-api rules on React projects, and prefer-takeuntil on Angular ones. No single linter catches everything, but each one runs on every commit without anyone deciding to run it.
Testing for leaks in CI is the next step, and it’s why Meta built MemLab in the first place: a framework that drives Puppeteer through a defined scenario and can fail a build when an interaction crosses an agreed memory-regression threshold. Meta itself runs it on a schedule against an internal dashboard rather than per commit, and the same approach bolts onto most CI/CD setups. Either way, it turns leak detection from an expert-level task into a routine one.
Documenting the relationships between components matters just as much. Start with an inventory of every cache in the system: what it stores, its bound, and its eviction policy. Add teardown contracts to module documentation describing who’s responsible for removing each subscription. Set a memory budget in the service runbook, combining the container’s configured ceiling with the expected steady-state heap, and place the alert threshold between the two. Without that inventory, a review checklist stays aspirational: nobody can tell whether an unlisted cache is properly bounded.
Bring the same questions into code review: what removes this listener; does this cache have a ceiling; will this closure outlive the data it captured; what happens if the component unmounts mid-request, and who cleans that up.
Watch memory trends over time rather than static thresholds alone, which typically only fire after the damage is done. While watching the heapUsed trend over hours, check what your process manager is quietly papering over.
| Recycling a worker every few hours became an accepted way to run Node in production, to the point that PM2’s own page for memory-threshold restarts is billed as a fast way to fix memory leaks temporarily. It works, and that’s precisely the problem: a workaround that works eventually becomes load-bearing, letting the leak beneath it survive for years. |
Treat third-party libraries as suspects until proven innocent. A library’s JavaScript object references look identical to your own code in a heap snapshot, and a native allocation from a third-party library may only be partially visible there. npm audit checks for known security vulnerabilities, not memory behavior, so wrapping external calls in your own lifecycle boundaries at least gives you somewhere to clean up after them.
Finally, some of this work needs outside help occasionally. Analyzing retainers and V8’s context-allocation behavior are specialized skills most teams need only a few times a year, which makes hiring for them full-time hard to justify, exactly the kind of intermittent need that project-based engineering support tends to cover well.
Where Reachability Ends and Ownership Begins
Every common leak inside the garbage collector’s own heap comes down to the same shape: an unbroken chain of references running from a root to data the application is done with. Accidental globals, shared closure scopes, abandoned timers, retained promises, and unbounded caches are one failure wearing different clothes, whether the process is running in a browser or on a server.
WebAssembly linear memory and native bindings introduce a second, distinct class of problem. There, the issue is ownership, not reachability: a C allocator can lose its last internal pointer with no JavaScript reference left to follow to find it.
Which class a leak falls into determines which instrumentation gives you the right picture, and the answer is less obvious than it looks: different measurements of the same process report very different numbers. In our Node 22 / V8 12.4 experiments, heapUsed reported roughly 4.1 MB of additional heap, while arrayBuffers reported roughly 39.1 MB of additional buffers, with nearly all the combined growth traced back to native backing-store nodes inside the heap snapshot, not to the JS heap itself. The hardest leaks to find remain the ones created by a native add-on allocating memory outside V8, and those inside WebAssembly linear memory, where a snapshot can show total buffer size without identifying the allocator object responsible for it.
What’s changed recently is the tooling around ownership. Linting picks off pieces of several patterns for free. using and Symbol.dispose reached Stage 4 at TC39, already running natively in Node.js 24. TypeScript’s Disposable turns a missing cleanup requirement into a compiler error. napi-rs lets developers define callback ownership, calling context, and borrowed-data lifetimes directly in the type system. These are worth adopting for the same reason static typing was: a contract a machine can check beats a convention a reviewer has to remember.
The rest of the work is organizational. Meta’s numbers make that case better than any argument could: by scheduling leak tests instead of relying on code review, its team reported cutting its out-of-memory crash rate by roughly half.
Frequently Asked Questions
What causes memory leaks in JavaScript?
Some part of the code holds onto a reference it no longer needs. That’s the entire problem. The collector keeps alive anything reachable from a root, so one forgotten listener, one uncleared timer, one cache entry, or one closure that captured more than intended is enough to keep that memory pinned for as long as the retaining path stays alive.
Does garbage collection prevent all memory leaks?
No. GC only frees objects no longer reachable from a root. If code still holds a reference to data it’s done with, that’s a leak, and the collector will never flag it: it tracks reachability, not intent. As far as it can tell, the application still wants that object.
How long does a memory leak take to show up in production?
Anywhere from minutes to weeks, depending on how much each instance of the leak retains and how often the leaky code path runs. Slow leaks routinely survive initial testing and canary deploys, then surface only under sustained traffic.
When should you use WeakMap instead of Map?
When the objects used as keys have lifetimes outside your control: DOM nodes, user session objects, and similar cases. Once nothing else references the key object, the key and its entry become eligible for collection, so the cache stops pinning them, though exactly when that collection happens is left unspecified.
Does TypeScript prevent memory leaks?
No. Because types get erased before runtime, type-checked code can still leak memory. Starting in TypeScript 5.2, though, the compiler can verify that a class implementing Disposable actually defines [Symbol.dispose()], which turns cleanup into a mandatory part of the interface contract rather than a convention.
Can a third-party npm package leak memory?
Yes. A package leak that sits in the JavaScript heap looks identical to your own leaked code in a heap snapshot, with the retainer chain running into the package. A leak inside a package’s native C++ code is harder to catch, since memory allocated outside V8 doesn’t have to appear in the snapshot at all.
How should engineering teams monitor memory leaks in Node.js?
Watch memory trends, not a single threshold. At minimum, track heapUsed, arrayBuffers, external, and rss separately, and correlate any sustained climb with traffic, deployments, restarts, and OOM events on the same timeline. When a leak is suspected, combine those runtime metrics with a heap snapshot comparison and, if native code is involved, the native-memory diagnostics covered above; no single measurement tells the whole story on its own.
By Pablo Bassil
Pablo is a senior software engineer with 15+ years of experience in full-stack development. He serves as tech lead at Red Ventures, building serverless architectures using React, Go, Node.js, and AWS. Pablo has also worked with Paychex on mobile and web applications.
Expertise